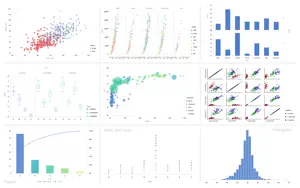
GPlot is the modern platform for agile business intelligence and data on the grammar of graphics, which tries to take the good parts of base and lattice graphics and none of the bad parts. It takes care of many of the fiddly details that make plotting a hassle (like drawing legends) as well as providing a powerful model of graphics that makes it easy to produce complex multi-layered graphics.
+ Special Plots
- Bubble
- Jitter Point
- Nightingale Rose
- Scatter Matrix
+ Boxplot
- Basic Boxplot
+ Common Plots
- Facet Scatter
- Facet Line
- Facet Bar (include Stack and Dodge)
- Facet Pie
- Facet Area (include Stack)
+ Statistics
- Stem and Leaf
- Histogram
- Pareto
版本更新内容:
jitter point plot\ nightingale rose plot\ area plot(include stack mode)\ bar plot(include stack and dodge mode)
5. add pie plot

-
![啜色]() 啜色 内购:免费详情
啜色 内购:免费详情 -
![重复的联系人管理器]() 重复的联系人管理器 内购:免费详情
重复的联系人管理器 内购:免费详情 -
![写作业]() 写作业 内购:免费详情
写作业 内购:免费详情 -
![Stop Motion Studio]() Stop Motion Studio 内购:免费详情
Stop Motion Studio 内购:免费详情 -
![轻松记工时 - 小时工记账 工时记录 安心可靠]() 轻松记工时 - 小时工记账 工时记录 安心可靠 内购:免费详情
轻松记工时 - 小时工记账 工时记录 安心可靠 内购:免费详情